
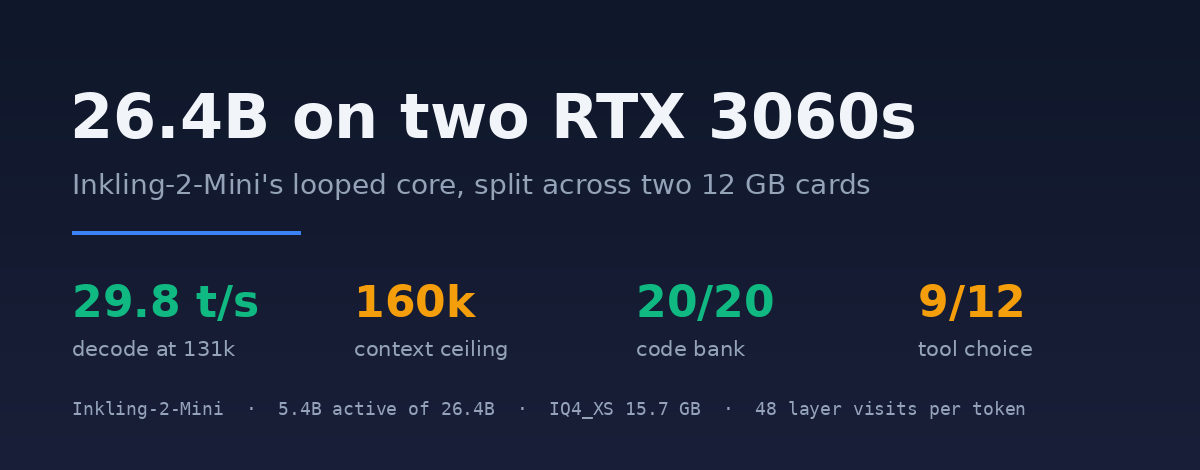


A 26-billion-parameter model that scores above my daily 27B on the published coding benchmarks, running at 160k context on two 12 GB cards — and for two days I was convinced it could not be done. This is the record of what actually blocked it, because none of the three blocks was the one I expected.
The model is Inkling-2-Mini from Thinking Machines: 26.4B total parameters, 5.4B active per token, Apache-2.0, with a looped core. The claim from Unsloth’s release page is that it beats Qwen3.8-27B, the model this machine has been running as its daily driver for a week. That claim is why I tried it at all.
The short version: it runs, at 29.8 tokens per second, on both cards, at 160k context, and it passed the same 20-task code bank the 27B passes. It is about half the 27B’s speed and it picks tools slightly worse. It is now the third model in the rotation on this desktop.
The machine
| CPU | Ryzen 7 5700X, 8 cores / 16 threads |
| RAM | 31 GiB DDR4 |
| GPUs | 2× RTX 3060 12 GB — one on PCIe 4.0 ×4, one on ×16, no P2P |
| Storage | SATA SSDs only; the weights live on a 2.5″ SSD |
| OS | Linux Mint 22.3, kernel 7.0.0, CUDA 13.2 driver |
| Model | Inkling-2-Mini UD-IQ4_XS, 15.73 GB |
These are consumer cards without NVLink, so cross-card traffic goes through the host. Every multi-GPU number below is tensor-parallel-free: layer split, one card after the other, GGML_CUDA_ALLREDUCE=internal. The 27B has been doing exactly this at 131k for a week, so the shape is proven on this box.
What a looped model is, and why it changes the arithmetic

Inkling-2-Mini is not a stack of 48 transformer layers. The GGUF stores 24 physical blocks, and blocks 6 through 17 are executed three times in sequence. A forward pass therefore visits 48 layers while the file only holds 24 sets of weights.
This is why the model gets quality normally associated with a much larger model out of 15.7 GB: the loop spends compute, not memory. The loop segment is re-used, so its parameters are trained three times as hard. It is also why the speed is not what the parameter count suggests.
Two consequences matter here, and they are not obvious from the model card:
- There is one KV cache per visited layer, not one per stored layer — eight of them, each with a 1,024-token sliding window. That is 32 KiB per token at BF16, far above what a 27B pays, which is why context is expensive on this model and why the KV type matters.
- Every offloaded layer costs twice. If half the visits run on the CPU, you are not paying half speed; you are paying the loop multiplier on every one of those visits.
Three walls, in the order you hit them

The model card gives you one line: llama-server -m model.gguf -ngl 99. On this box that line fails three different ways before it works, and each failure looks like a broken download.
Wall 1: the stock build does not know the architecture
The GGUF declares general.architecture = inkling2. Two of my existing llama.cpp builds contain that string and still refuse the file:
llama_model_load: error loading model:
  check_tensor_dims: tensor 'blk.24.attn_q.weight' not found
A 24-block file has no block 24. The loader is looking for the tensors of the 25th layer visit, because the loop means the graph needs per-visit tensors while the file stores per-layer ones. You need a build with looped-layer support: Unsloth’s fork, or mainline from b12600 onward, where the loop landed as PR #32694.
Wall 2: mainline loads it and still cannot use the second card
Mainline b12600 loads the model and produces coherent text — I checked, it computes 17×23 correctly with its reasoning visible. So the natural conclusion is that it works. Then you look at the cards:
-sm tensor -> LLAMA_SPLIT_MODE_TENSOR not implemented for architecture 'inkling2'

-sm layer  -> ggml_backend_cuda_buffer_type_alloc_buffer:
              allocating 14194.22 MiB on device 0: cudaMalloc failed
Tensor split is refused outright. Layer split is accepted and then ignored: with --tensor-split 1,1, with 0.5,0.5, with 1.08,1, the allocation on device 0 stays between 13,586 and 14,161 MiB. The merged implementation keeps the looped core in one contiguous buffer, on one device. A 12 GB card cannot hold 14 GiB, so on a two-card 12 GB box mainline is a dead end even though it “supports” the model.
This is the single most useful thing I learned: architecture support and device support are different features. The release that made Inkling loadable did not make it splittable.
Wall 3: Unsloth’s fork splits, and the graph still does not fit
The fork’s loader is different and it splits correctly. Same file, same flags:
GPU0 10,149 MiB GPU1 11,521 MiB both cards, whole modelBut with the default micro-batch the server dies after the weights are placed:
ggml_backend_cuda_buffer_type_alloc_buffer:
  allocating 2565.48 MiB on device 1: cudaMalloc failed
That is the prefill graph, not the model. A batch of 2,048 tokens spread across 48 layer visits needs a compute buffer that has nowhere to go once the cards are full. Shrinking it fixes everything:
-ub 64 -b 256The recipe
llama-server \
  -m Inkling-2-Mini-UD-IQ4_XS.gguf --alias Inkling-2-Mini --jinja \
  -c 131072 -ngl 48 --split-mode layer --tensor-split 1.08,1 --parallel 1 \
  -ctk q4_0 -ctv q4_0 -fa on -ub 64 -b 256 \
  --temp 1.0 --top-p 1.0 --top-k 0 --min-p 0.0 \
  --threads 12 --host 127.0.0.1 --port 18448
-ngl 48 |
48 visits, not 24 blocks. -ngl 24 leaves the looped core on the CPU and costs five times the speed. |
-sm layer |
the only multi-device path this architecture has. |
-ts 1.08,1 |
device 1 also drives the desktop; skew the weights so both cards fill at the same moment. |
-ctk/-ctv q4_0 |
eight KV caches make context expensive; q4_0 buys 32k of it back. |
-ub 64 -b 256 |
keeps the prefill graph inside the remaining VRAM. |
temp 1.0 / top-p 1.0 / top-k 0 / min-p 0.0 |
the model samples very differently at temperature 0.7 — these are its own recommended settings. |
Measurements
Speed at 131k context
| case | prefill | decode |
|---|---|---|
| cold, 1,163-token prompt | 246.4 t/s | 29.72 t/s |
| warm, same prompt | — | 29.86 t/s |
| 6,315-token prompt | 252.5 t/s | 29.82 t/s |
| 26,614-token prompt (at 160k) | 253 t/s | 27.9 t/s |
Context is almost free: 32k and 131k decode at the same 29.8 t/s. The budget goes into the KV caches, not into a slower graph — which is the opposite of what I expected from a model with eight caches.
Quality, on the bank my other models are graded with
| model | 20-task code bank | mean t/s | tool choice | context |
|---|---|---|---|---|
| Inkling-2-Mini IQ4_XS | 20/20 | 30.7 | 9/12 | 160k |
| Qwen3.8-27B (abliterated Q4_K_M) | 20/20 | 49.7 | 11/12 | 131k |
| Huihui-Devstral-24B Q4_K_M | 20/20 | 31.3 | — | 131k |
The bank is twenty small but real tasks — deep-copy semantics, parsing, edge cases, an off-by-one in a range — each checked by executing the answer, not by reading it. All three models pass all twenty. The difference is speed and tool choice.
The three tool-choice misses are all the same failure mode: it reaches for terminal where a narrower tool is correct. That matches the reputation the model has in agent harnesses — very strong on code, weaker at choosing from a large menu. If you run it, keep the tool list short.
End to end through the harness
Through my agent harness, with its full 29k-token prefix of tool schemas and skills: a one-word answer took 2 minutes 25 seconds. That number is the first turn, not steady state — 29k tokens prefilled at ~250 t/s, then the model reasoning before answering. Steady-state conversation after that is at the 29.8 t/s above.
Where the ceiling actually is

| context | outcome |
|---|---|
| 131,072 | fits — 1,764 MiB free on GPU0, 390 on GPU1 |
| 163,840 | fits — 1,356 / 218 MiB free. This is the ceiling here. |
| 196,608 | fails: allocating 2997.48 MiB on device 1: cudaMalloc failed |
| 262,144 | fails: 3562.48 MiB on device 0 and 3193.95 MiB on device 1 |
The model card advertises a million tokens; the GGUF declares 262,144 positions. Neither is reachable here. About 1.8 GiB of VRAM is left in total and each additional 32k of context costs roughly 0.5 GiB, so 160k is the arithmetic limit for 15.7 GB of weights on 24 GB of card. I verified the 160k setting with a 26,614-token prompt rather than trusting that it loaded: prefill 253 t/s, decode 27.9 t/s, no allocation failure.
What does not work
Mainline, for now. b12600 pins everything to device 0 as described above, and Unsloth’s separate Mainline_Support GGUF set is reported to produce gibberish until per-expert NVFP4 scales land in a later PR. The fork is not optional yet.
The uncensored build. AtomicChat published a refusal-removal LoRA and baked GGUFs; the 16.53 GB AD-Q4_K variant uses a different internal layout (inkling2_loop, 704 tensors) from Unsloth’s inkling2. Mainline b12600 loads it and answers coherently — their warning about gibberish is stale for that build — but it inherits the same single-device limitation: tensor split unimplemented, layer split puts a 14,194 MiB buffer on device 0. The only shape that runs is partial offload at -ngl 24, which measured 5.97 t/s decode, 44 to 46 t/s prefill. Their adapter cannot be applied to an Unsloth file either; the engine rejects it with a model/adaptor architecture mismatch. It needs a build that both knows the layout and splits it, and as of this writing no branch of the fork registers that layout.
Partial offload in general. My first “working” configuration was -ngl 18: 10.1 GiB on one card, 30 blocks on the CPU, 16 GB of host RAM, 5.7 to 6.0 t/s, and tool choice dropped to 7/12. A big model limping is worse than a smaller model running, and it took a day to accept that.
Short evaluation budgets. Inkling emits a reasoning stream even with thinking disabled. At a 420-token cap my gates reported a Python syntax error and an undefined name — both were the answer being cut mid-thought, not model defects. At 1,600 tokens for a code bank and 900 for tool choice, both tasks pass. If you benchmark a reasoning model with a small budget, you are benchmarking your budget.
What other people get, and why it is not a contradiction
| rig | path | decode |
|---|---|---|
| RTX 4090 | vLLM, NVFP4 experts + FP8 KV, patched | 190–220 t/s |
| RTX 4090 | Xolotl engine, ~14 GB | 59.7 t/s |
| DGX Spark | vLLM TP1, NVFP4/MXFP8 | 47.7 t/s |
| M5 Max 48 GB | exo / MLX | 125 t/s |
| M5 Ultra 96 GB | exo / MLX | 210 t/s |
| RX 9070 XT 16 GB | llama.cpp b12600, Vulkan, IQ3_XXS | 20.8 t/s |
The last row is the one worth reading twice. On the plain llama.cpp path, on a card of the same generation class as mine, Inkling runs at 20.8 t/s while Qwen3.8-27B runs at 25.6 t/s on the same machine. Every headline number above needs something this desktop does not have: FP8 or NVFP4 tensor cores, unified memory, or a bespoke engine. The loop costs 48 layer visits per token no matter how fast your memory is.
There is also a 5090 owner in the Unsloth thread who hit exactly my first wall and summarised it better than I did: “1.8 GiB on the GPU, 15 GiB on the CPU… will run but it’s not usable.” He was on default micro-batch too.
Verdict
It is in the rotation, as the third option next to the 27B and Devstral. What it buys: a model that passes my code bank, holds 160k of context, and does it at half the speed of my 27B. What it costs: two cards fully occupied, so the 27B is offline while it runs, and a tool-choice score three points worse. For long-document work with a small tool menu it is the better tool. For fast interactive coding turns, the 27B still wins.
The part worth keeping from this exercise is the shape of the failure, not the victory: a release announcement says “supported”, the loader loads, the model answers — and it is still unusable on your hardware because the loader quietly made a decision about devices that the flags cannot override. The only way to find that out is to measure the allocator, not the benchmark.
Reproduce it
Everything is published: the launcher, the switch script, the 20-task bank, the tool-choice prompt set, and the raw logs of every number above.
- Repository: github.com/dailybarid/inkling-2-mini-2×3060
- Weights: unsloth/Inkling-2-Mini-GGUF (UD-IQ4_XS, 15.73 GB)
- Engine: Unsloth’s llama.cpp fork, build b12588 — the only build that splits this architecture across two cards
GATE_URL=http://127.0.0.1:18448/v1/chat/completions \
  python3 bench/quality.py Inkling-2-Mini inkling
python3 bench/smoke.py http://127.0.0.1:18448 Inkling-2-Mini
python3 bench/speed.py http://127.0.0.1:18448
The same three scripts are what produced every number in this article, including the ones that were disappointing.
Leave a Reply
You must be logged in to post a comment.